

UNITED STATES—
Key Highlights
|
Every school morning, 1.1 million California students board buses on roads where 5,821 crashes strike annually, the second largest crash toll of any state in the nation. California ranks 4th most dangerous nationwide with a Risk Score of 25, a crash rate of 529.2 per 100,000 students, and 28.04 in every 100 road miles rated unacceptable. Behind each number is a driver navigating deteriorated infrastructure daily in a state with every resource to do far better.
The study by Grigor Law Injury & Car Accident Lawyers analyzed NHTSA crash records from 2019 to 2023 alongside BTS road condition assessments across all 50 states. Risk scores combine crash frequency weighted at 70% and infrastructure quality weighted at 30%.
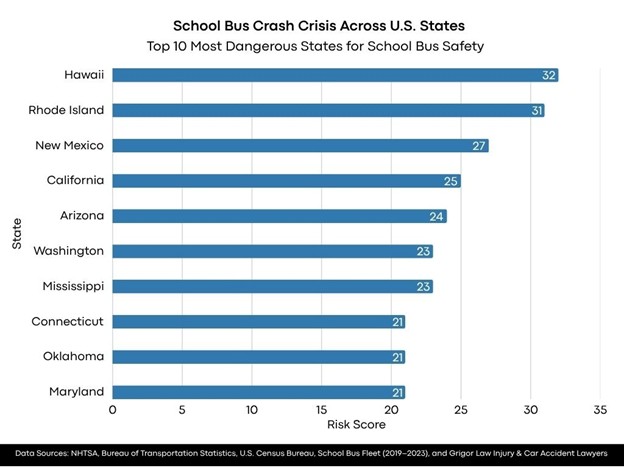
California Ranked 4th in Composite Risk Among All 50 States
| Rank | State | Risk Score | Crashes per 100K | % Unacceptable Roads |
|---|---|---|---|---|
| 1 | Hawaii | 32 | 505.5 | 39.09 |
| 2 | Rhode Island | 31 | 88.6 | 44.75 |
| 3 | New Mexico | 27 | 433.3 | 32.97 |
| 4 | California | 25 | 529.2 | 28.04 |
| 5 | Arizona | 24 | 555.8 | 25.75 |
| 6 | Washington | 23 | 279.0 | 29.63 |
| 7 | Mississippi | 23 | 248.1 | 29.85 |
| 8 | Connecticut | 21 | 92.8 | 29.97 |
| 9 | Oklahoma | 21 | 243.3 | 26.88 |
| 10 | Maryland | 21 | 131.9 | 28.72 |
California’s Risk Score of 25 places it 4th nationally, with 529.2 crashes per 100,000 students and 28.04 in every 100 road miles failing. Five of the six most dangerous states are Western, and California sits at the heart of that regional crisis. Only Hawaii, Rhode Island, and New Mexico rank more dangerous for school bus drivers.
Looking at the study, Chrissy Grigoropoulos, Founder of Grigor Law Injury & Car Accident Lawyers, commented:
“The eight times safety gap between states exposes a national crisis where drivers face dramatically different risks based solely on geography. Comprehensive approaches addressing traffic enforcement, driver education, and road design are essential to protect those transporting our children daily.”
California Records Third-Highest Crash Rate and Over 5,800 Annual Crashes
| State | Crashes per 100K | Avg Annual Crashes | Students Transported Daily |
|---|---|---|---|
| Florida | 747.9 | 5,071.6 | 678,123 |
| Arizona | 555.8 | 1,673.6 | 301,135 |
| California | 529.2 | 5,821.6 | 1,100,000 |
| Hawaii | 505.5 | 134.0 | 26,511 |
| Nebraska | 505.1 | 336.8 | 66,681 |
California’s 5,821.6 average annual crashes are the second highest of any state, representing over 10 in every 100 school bus crashes recorded nationally. Florida and Arizona lead on crash rates at 747.9 and 555.8 per 100,000, respectively, but California’s combination of a 529.2 rate and 1.1 million daily riders creates the second largest absolute crash burden in the country.
California’s 7,293 Miles of Failing Roads Rank 4th Highest in the Nation
| State | % Unacceptable Roads | Risk Score | Crashes per 100K |
|---|---|---|---|
| Rhode Island | 44.75 | 31 | 88.6 |
| Hawaii | 39.09 | 32 | 505.5 |
| New Mexico | 32.97 | 27 | 433.3 |
| Connecticut | 29.97 | 21 | 92.8 |
| Mississippi | 29.85 | 23 | 248.1 |
California ranks 8th nationally by percentage of unacceptable roads at 28.04 in every 100 miles, but that rate across its 26,014-mile network produces 7,293 miles of failed or poor-condition surface, the fourth largest unacceptable road mileage of any state in the country. Rhode Island and Hawaii carry higher percentages, but their smaller networks mean California’s absolute mileage burden dwarfs theirs in real-world impact.
Among Largest State Systems, California Carries the Worst Safety Record
| State | Students Transported Daily | Crashes per 100K | Risk Score | Rank |
|---|---|---|---|---|
| New York | 2,087,748 | 70.9 | 17.3 | 21 |
| Texas | 1,548,374 | 383.7 | 20.1 | 13 |
| Pennsylvania | 1,412,379 | 118.7 | 19.7 | 15 |
| California | 1,100,000 | 529.2 | 25.0 | 4 |
| Illinois | 976,971 | 178.4 | 15.2 | 22 |
California’s crash rate of 529.2 per 100,000 students is nearly seven times higher than New York’s 70.9 and four times higher than Pennsylvania’s 118.7, despite all three operating at comparable scales. New York transports over two million students daily with a risk score of 17.3, proving that size alone does not drive danger.
Methodology
This study calculates composite risk scores from 0 to 100 for all 50 states using normalized school bus crash rates and federal infrastructure assessments. Crash risk scores weighted at 70% utilize NHTSA data from 2019 to 2023, while road condition scores weighted at 30% use Bureau of Transportation Statistics pavement quality assessments. California-specific analysis draws on state-level crash totals, student transportation figures averaged across 2021 to 2024, and BTS road condition data across California’s 26,014 assessed road miles.
Data Sources
- National Highway Traffic Safety Administration – https://cdan.dot.gov/query
- Bureau of Transportation Statistics – https://www.bts.gov/road-condition
- School Bus Fleet Magazine – https://www.schoolbusfleet.com/download?id=10233821
- U.S. Census Bureau – https://www.census.gov/programs-surveys/popest.html
- Research Dataset – https://docs.google.com/spreadsheets/d/1pr0sL7E9lh8Wf4eKkL6SfpoZmxWDsmNwbBGSWJkSCjs/edit?usp=sharing
- Study By – https://grigorlaw.com/
About Grigor Law Injury & Car Accident Lawyers
Grigor Law Injury & Car Accident Lawyers is New York’s premier all-injury law firm, providing comprehensive legal representation for accident victims statewide. Founded by Chrissy Grigoropoulos, the firm combines data-driven advocacy with personalized client service to secure maximum compensation for clients injured in vehicle accidents, workplace incidents, and other personal injury cases.


