

UNITED STATES—
KEY HIGHLIGHTS
- From 2022 to 2024, California’s insurers paid a combined $570 million in dog bite liability claims.
- Dog bite claims in California rose 23.7% over the three years, from 1,954 in 2022 to 2,417 in 2024.
- California accounts for 13.2% of all national dog bite payouts despite representing just 10.9% of total claims, reflecting higher claim severity driven by the state’s strict liability laws, elevated medical costs, and larger settlements.
California is home to more dogs than any other state, and when bites occur, the financial consequences are among the steepest in the country. Over the past three years, dog bite liability claims have cost California’s insurers more than half a billion dollars, with both claim volumes and per-incident costs rising sharply, particularly in 2024.
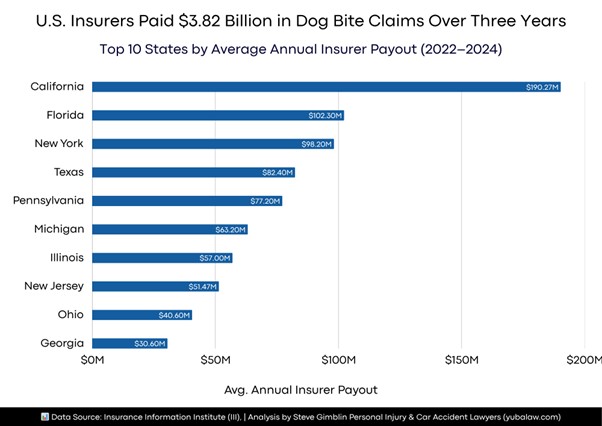
According to an analysis by Steve Gimblin Personal Injury & Car Accident Lawyers, the study examined dog bite liability claim data published by the Insurance Information Institute (III) for the years 2022, 2023, and 2024, ranking the 10 highest-volume states by their three-year average annual total insurer payouts.
California Tops the Nation With $190.27 Million in Average Annual Dog Bite Payouts
| Rank | State | Avg. Annual Claims (2022 to 2024) | Avg. Cost Per Claim | Avg. Annual Insurer Payout | Share of Top 10 Total |
| 1 | California | 2,158 | $77,724 | $190.27M | 23.99% |
| 2 | Florida | 1,561 | $66,833 | $102.30M | 12.90% |
| 3 | New York | 938 | $84,829 | $98.20M | 12.38% |
| 4 | Texas | 1,082 | $67,174 | $82.40M | 10.39% |
| 5 | Pennsylvania | 889 | $69,739 | $77.20M | 9.73% |
| 6 | Michigan | 992 | $60,775 | $63.20M | 7.97% |
| 7 | Illinois | 835 | $68,659 | $57.00M | 7.19% |
| 8 | New Jersey | 660 | $69,836 | $51.47M | 6.49% |
| 9 | Ohio | 843 | $44,899 | $40.60M | 5.12% |
| 10 | Georgia | 547 | $55,126 | $30.60M | 3.86% |
California dominates in both claim volume and total payout, with an average of 2,158 claims per year and $190.27 million in annual insurer payouts—nearly 86% more than the second-ranked state, Florida ($102.30 million). California alone accounts for nearly 24% of all top-10 state payouts.
California’s $77,724 Average Claim Cost Ranks Second Nationally, 21.2% Above the National Average
| Rank | State | Avg. Cost Per Claim (2022 to 2024) | Avg. Annual Claims | Avg. Annual Payout | Difference vs. California |
| 1 | New York | $84,829 | 938 | $98.20M | +$7,105 |
| 2 | California | $77,724 | 2,158 | $190.27M | — |
| 3 | New Jersey | $69,836 | 660 | $51.47M | -$7,888 |
| 4 | Pennsylvania | $69,739 | 889 | $77.20M | -$7,985 |
| 5 | Illinois | $68,659 | 835 | $57.00M | -$9,065 |
| 6 | Texas | $67,174 | 1,082 | $82.40M | -$10,550 |
| 7 | Florida | $66,833 | 1,561 | $102.30M | -$10,891 |
| 8 | Michigan | $60,775 | 992 | $63.20M | -$16,949 |
| 9 | Georgia | $55,126 | 547 | $30.60M | -$22,598 |
| 10 | Ohio | $44,899 | 843 | $40.60M | -$32,825 |
Only New York exceeds California in average cost per claim, at $84,829 versus California’s $77,724—a gap of just $7,105. However, California’s claim volume is more than double New York’s (2,158 vs. 938 per year on average), which is why California’s total annual payout of $190.27 million nearly doubles
California’s Total Dog Bite Payouts Surged 35.3% From 2022 to 2024
| Rank | State | Total Payout Change | Claims Change | Cost Per Claim Change | CA Payout Growth Comparison |
| 1 | Pennsylvania | +66.0% | +6.5% | +33.1% | +30.7pp above CA |
| 2 | Michigan | +61.6% | +3.0% | +28.6% | +26.3pp above CA |
| 3 | New York | +46.4% | -12.2% | +42.7% | +11.1pp above CA |
| 4 | New Jersey | +37.4% | +18.0% | -3.3% | +2.1pp above CA |
| 5 | California | +35.3% | +23.7% | +9.4% | — |
| 6 | Texas | +34.5% | +2.3% | +14.8% | -0.8pp below CA |
| 7 | Ohio | +32.3% | +34.5% | -11.5% | -3.0pp below CA |
| 8 | Illinois | +24.5% | +14.8% | -3.4% | -10.8pp below CA |
| 9 | Georgia | +8.3% | +4.2% | -23.5% | -27.0pp below CA |
| 10 | Florida | -2.6% | +15.1% | -28.8% | -37.9pp below CA |
California’s 35.3% total payout growth from 2022 to 2024 ranks fifth among the top 10 states. Unlike Pennsylvania and New York, where payout growth was driven primarily by rising per-claim costs, California’s increase was fueled by a combination of both factors: claim counts rose 23.7% while cost per claim increased 9.4%.
California’s Dog Bite Claims Jumped 23.7% From 2022 to 2024, Adding 463 New Filings
| Rank | State | Claims Change (2022 to 2024) | 2022 Claims | 2024 Claims | Net Change |
| 1 | Ohio | +34.5% | 658 | 885 | +227 |
| 2 | California | +23.7% | 1,954 | 2,417 | +463 |
| 3 | New Jersey | +18.0% | 550 | 649 | +99 |
| 4 | Florida | +15.1% | 1,331 | 1,532 | +201 |
| 5 | Illinois | +14.8% | 729 | 837 | +108 |
| 6 | Pennsylvania | +6.5% | 805 | 857 | +52 |
| 7 | Georgia | +4.2% | 475 | 495 | +20 |
| 8 | Michigan | +3.0% | 905 | 932 | +27 |
| 9 | Texas | +2.3% | 1,017 | 1,040 | +23 |
| 10 | New York | -12.2% | 969 | 851 | -118 |
California’s 23.7% increase in dog bite claims from 2022 to 2024 was the second-largest percentage growth among the top 10 states, trailing only Ohio’s 34.5%. In raw numbers, however, California’s net increase of 463 claims was by far the largest of any state in the country—more than double Ohio’s 227 and more than double Florida’s 201.
Methodology
This analysis is based on dog bite liability claim data published by the Insurance Information Institute (III), accessed at iii.org/table-archive/97558. The dataset covers the calendar years 2022, 2023, and 2024, providing state-level figures for dog bite liability claim counts, average cost per claim, and total claim payouts. Three-year averages were calculated for each metric to smooth annual fluctuations. The primary ranking uses average annual total insurer payout as the composite measure of financial exposure; secondary rankings examine average cost per claim and year-over-year percentage changes. The III dataset provides state-level data for the 10 states with the highest volume of dog bite liability claims; national totals encompass all U.S. states and territories.
Data Sources
- Insurance Information Institute (III), Dog Bite Liability, State-Level Claim Data: https://www.iii.org/table-archive/97558
- Research Dataset: https://docs.google.com/spreadsheets/d/1pUDVhT_XII9Nie6IYqMrVILS-HqSQ0kljUAVGyqVoA0/edit?gid=0#gid=0
- Research by: https://yubalaw.com/
About Steve Gimblin Personal Injury & Car Accident Lawyers
The study was conducted by Steve Gimblin Personal Injury & Car Accident Lawyers, a California-based law firm representing victims of car, truck, and motorcycle accidents. Led by experienced attorney Steve Gimblin, the firm helps injured clients navigate complex insurance claims and legal battles to secure the compensation and justice they deserve.


