

UNITED STATES—
Key Findings
|
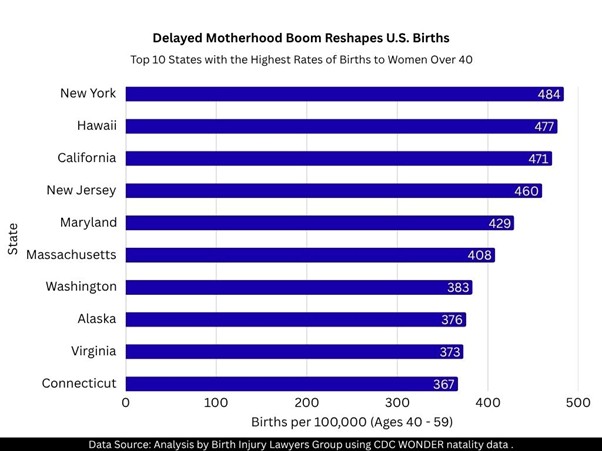
California isn’t just the most populous state. It’s the nation’s epicenter of later-life motherhood. Ranking third with 471 births per 100,000 women ages 40 to 59, it accounts for roughly one in six such births nationwide. And the trend is accelerating: a steady 11.9% rise over five years signals that more California women than ever are choosing motherhood on their own timeline.
The study conducted by Birth Injury Lawyers Group analyzed five years of CDC WONDER natality data (2020 – 2024) and U.S. Census Bureau population estimates to calculate average annual birth rates per 100,000 women ages 40 – 59 across all 50 states. States were classified into four regions per U.S. Census Bureau definitions; findings reflect correlations only and do not account for variables such as fertility treatment access, migration, or socioeconomic factors.
California Year-by-Year: Births to Women Over 40 (2020 – 2024)
| Year | Live Births (Ages 40-59) | Year-on-Year Change | % Change | Births per 100,000 Women |
|---|---|---|---|---|
| 2020 | 21,839 | N/A | N/A | 432 |
| 2021 | 22,290 | +451 | +2.1% | 448 |
| 2022 | 23,898 | +1,608 | +7.2% | 491 |
| 2023 | 23,952 | +54 | +0.2% | 491 |
| 2024 | 24,437 | +485 | +2.0% | 495 |
Births to women over 40 in California climbed steadily from 21,839 in 2020 to a five-year peak of 24,437 in 2024, a net gain of 2,598. The breakout moment came in 2022, when a 7.2% single-year surge pushed the rate past 491 per 100,000 for the first time. Growth briefly plateaued in 2023 before recovering in 2024, when California hit its highest recorded rate of 494.5.
California vs. West Region Peers
| State | National Rank | Births per 100,000 | Avg. Annual Births | Female Pop. (40-59) |
|---|---|---|---|---|
| Hawaii | 2 | 477 | 830 | 173,958 |
| California | 3 | 471 | 23,283 | 4,943,531 |
| Washington | 7 | 383 | 3,623 | 946,158 |
| Alaska | 8 | 376 | 312 | 83,003 |
| Utah | 11 | 366 | 1,349 | 368,772 |
| Colorado | 12 | 359 | 2,558 | 712,243 |
| Nevada | 18 | 324 | 1,287 | 396,554 |
| Oregon | 20 | 323 | 1,700 | 525,791 |
| Arizona | 23 | 296 | 2,573 | 868,712 |
| Idaho | 24 | 293 | 652 | 222,756 |
| Montana | 32 | 256 | 332 | 129,773 |
| New Mexico | 38 | 246 | 615 | 250,020 |
| Wyoming | 44 | 230 | 153 | 66,558 |
Within the West, California ranks second only to Hawaii, trailing by just 6 points in rate while serving a female population of 40 to 59 year old that is more than 28 times larger. The state’s average annual birth count of 23,283 dwarfs every other West region state, with the next closest, Washington, recording just 3,623 annually. Wyoming, the lowest-ranked West state at 230 per 100,000, records a rate less than half that of California, illustrating the enormous variation across the region.
California vs. National Benchmarks
| Metric | California | National Benchmark | Difference |
|---|---|---|---|
| Births per 100,000 (Avg. 2020-2024) | 471 | 303 | +55.6% above avg |
| Average Annual Births (2020-2024) | 23,283 | 2,826 (U.S. avg. per state) | 8.2 of national per-state avg |
| Total Births 2020-2024 | 116,416 | 141,304 (national annual); 706,518 over 5 years | Approx. 16.5% of all U.S. births |
| Growth 2020 to 2024 | +11.9% | +17.4% (national) | 5.5 percentage points below |
Against national benchmarks, California stands in a category of its own by volume. At 471 births per 100,000, the state exceeds the national average of 303 by nearly 56%, and its 23,283 average annual births represent approximately 16.5% of all later-life births recorded across the United States each year. At 11.9% growth from 2020 to 2024, California trails the national growth rate of 17.4% by 5.5 percentage points, yet its dominant rate position and unmatched birth volume signal that later-life motherhood in California is a deeply embedded demographic reality rather than an emerging trend.
Methodology
The study focuses exclusively on California using five years of CDC WONDER natality data (2020-2024) and U.S. Census Bureau population estimates for women aged 40-59. Birth rates are calculated per 100,000 women and averaged across the study period to smooth annual fluctuations. Birth counts reflect CDC WONDER natality records capturing reported maternal ages through 54; the population denominator includes women aged 55-59, among whom births are exceedingly rare, producing a conservatively measured rate. Year-on-year percentage changes are calculated using raw CDC birth counts. National and West regional averages are included solely for benchmarking purposes. This analysis reflects correlations only and does not account for migration, fertility treatment access, or socioeconomic variables.
Data Sources
Birth Data: Centers for Disease Control and Prevention (CDC) WONDER Database, Natality Information, 2020 – 2024: http://wonder.cdc.gov/controller/saved/D149/D475F172
Research Dataset: https://docs.google.com/spreadsheets/d/1A1PK8BpMsJDXZY5E5VE8n1ZSseQHiFONu7s4CvqUMd8/edit?gid=0#gid=0
Study by: https://birthinjurylawyer.com/
About Birth Injury Lawyers Group
Birth Injury Lawyers Group provides legal representation to families affected by birth injuries nationwide. The firm is committed to advocating for families while advancing public awareness of maternal and infant health trends through research and education initiatives.


